Let us begin with a simple thought.
- It is something most of us know.
- It is something most of us have felt.
- It is something you cannot perceive from the outside.
- It is something that pushes us away from others.
- It is something we ignore and don’t
- It is something that became SOMETHING during the COVID-19 pandemic.
- It is… Loneliness.
- And it is something big.
During the COVID-19 pandemic, a lot of us have struggled and as a matter of fact, some of us still are.
I have been one of those people, who didn’t know what it was at first. Because I never understood how it felt like to be in that state.
At least I thought I knew. But as the COVID-19 pandemic grew, it became evident that I was feeling lonely. Something was going on, which didn’t seem normal, for most of us...
Feeling exhausted after some work, and then deep thoughts that somehow gave an overwhelming feeling.
The feeling of being disconnected despite the fact that you are surrounded by dozens of people.
The isolation. The feeling of being disengaged, not by choice.
Having friends all over the world, but no one who truly ‘gets’ you or ‘understands’ you.
Being away from friends and family, with no way to meet them.
It all just added up.
I enjoyed solace and space. But this was different. That's when i realized, what loneliness truly is.
This is my story.
And I am NOT THE ONLY ONE suffering.
The struggles during the COVID-19 pandemic have been difficult, and I want to address one of them - Loneliness.
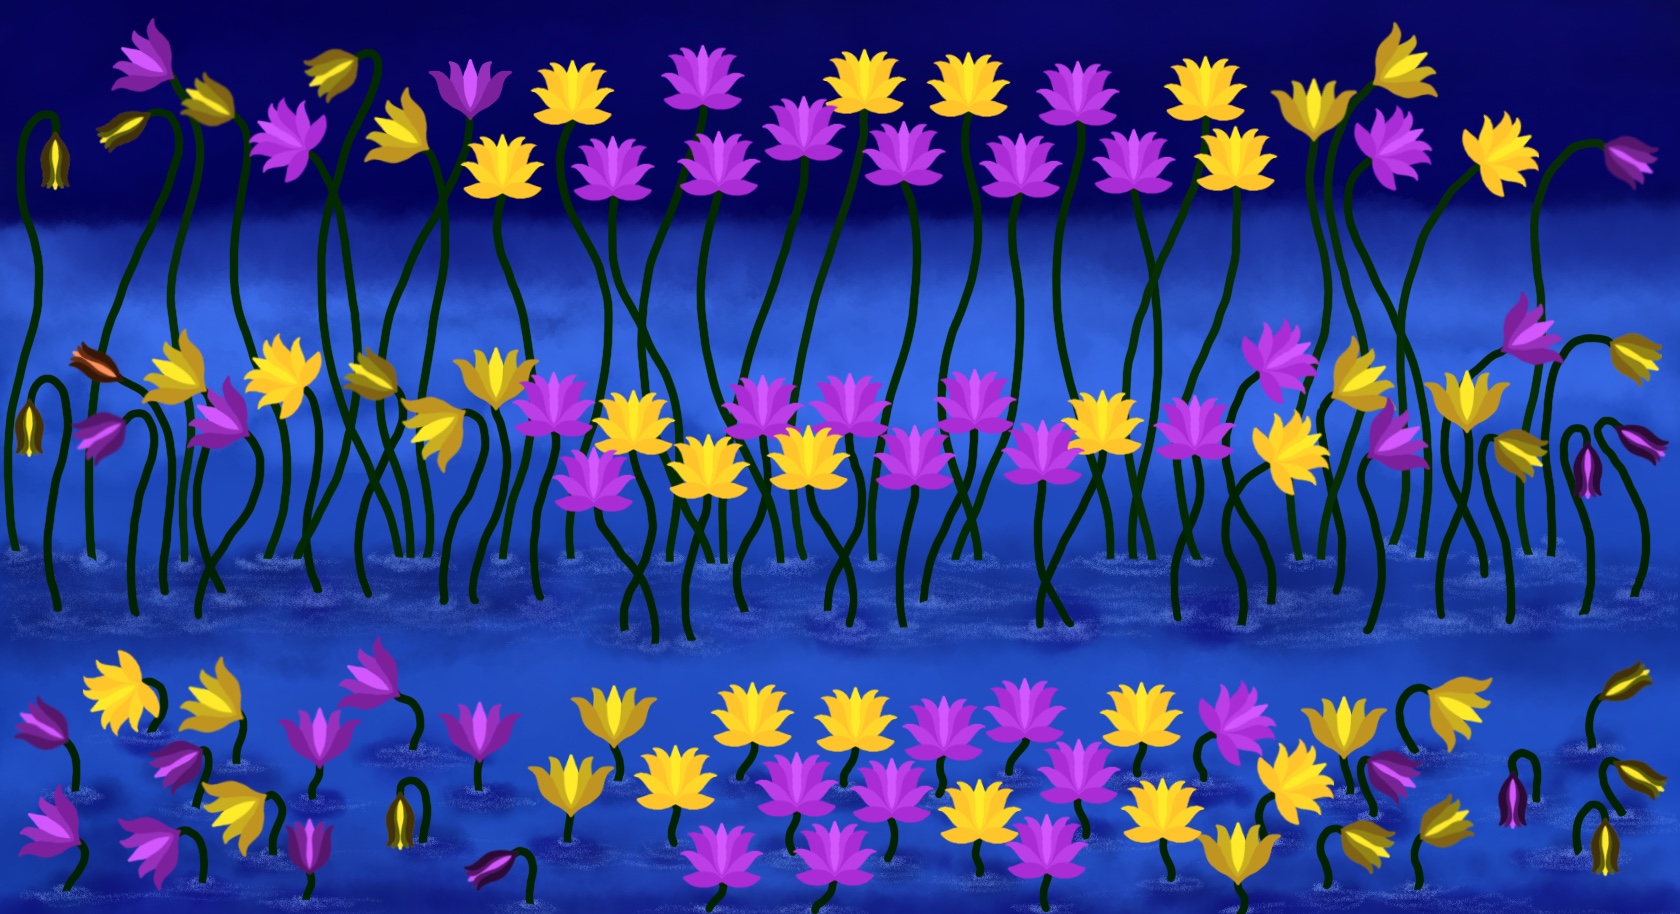
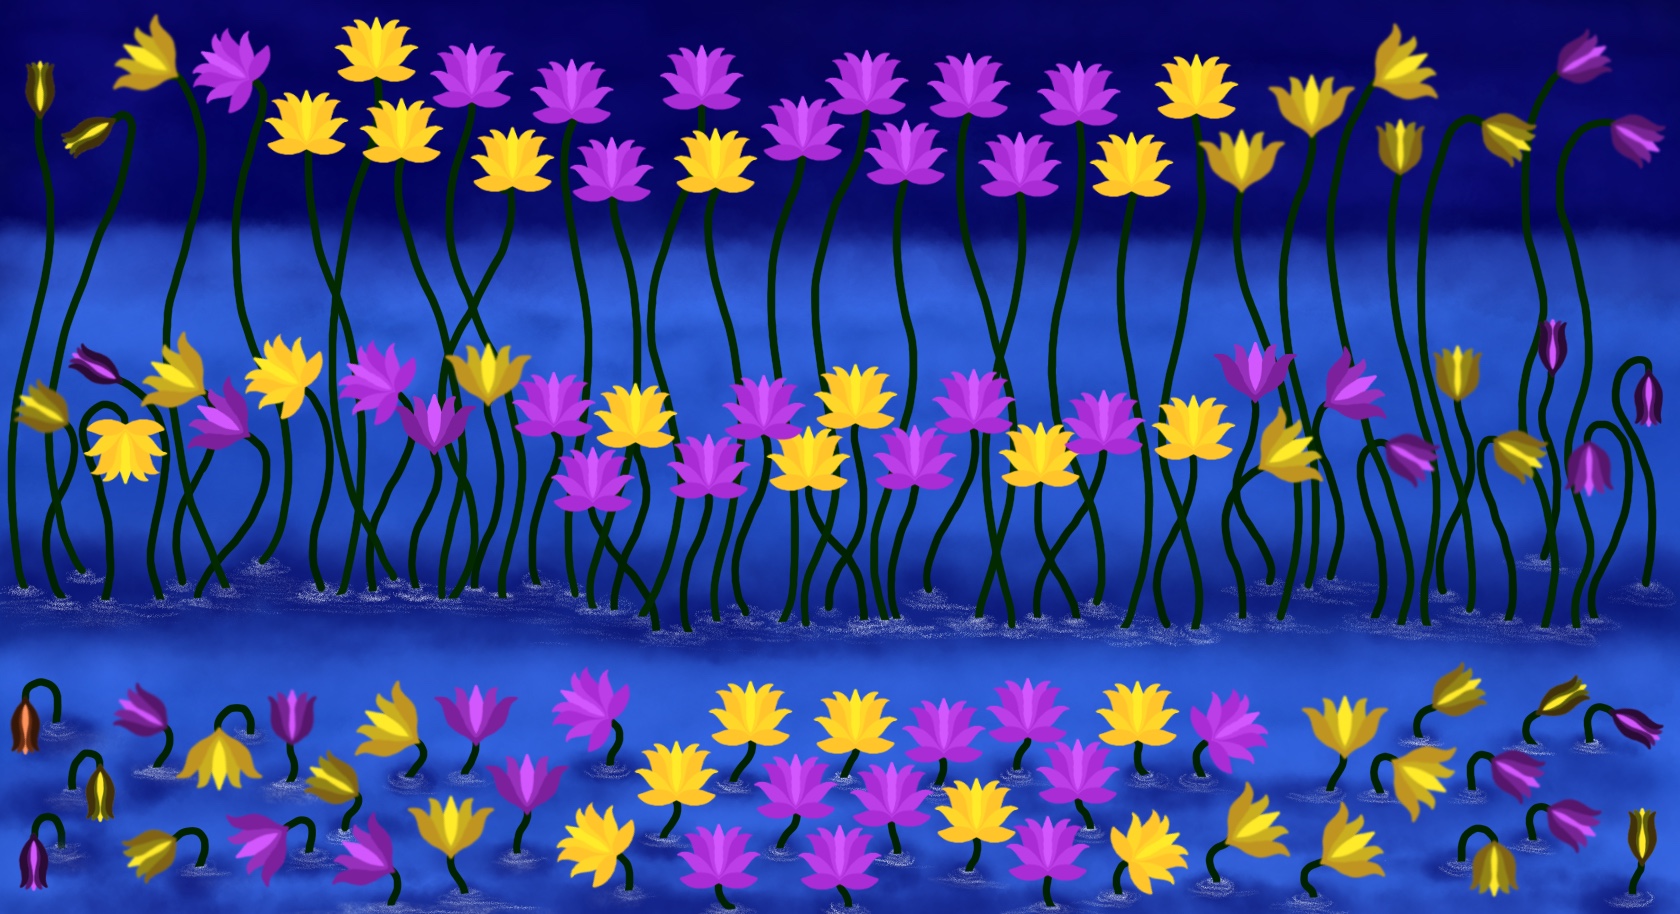
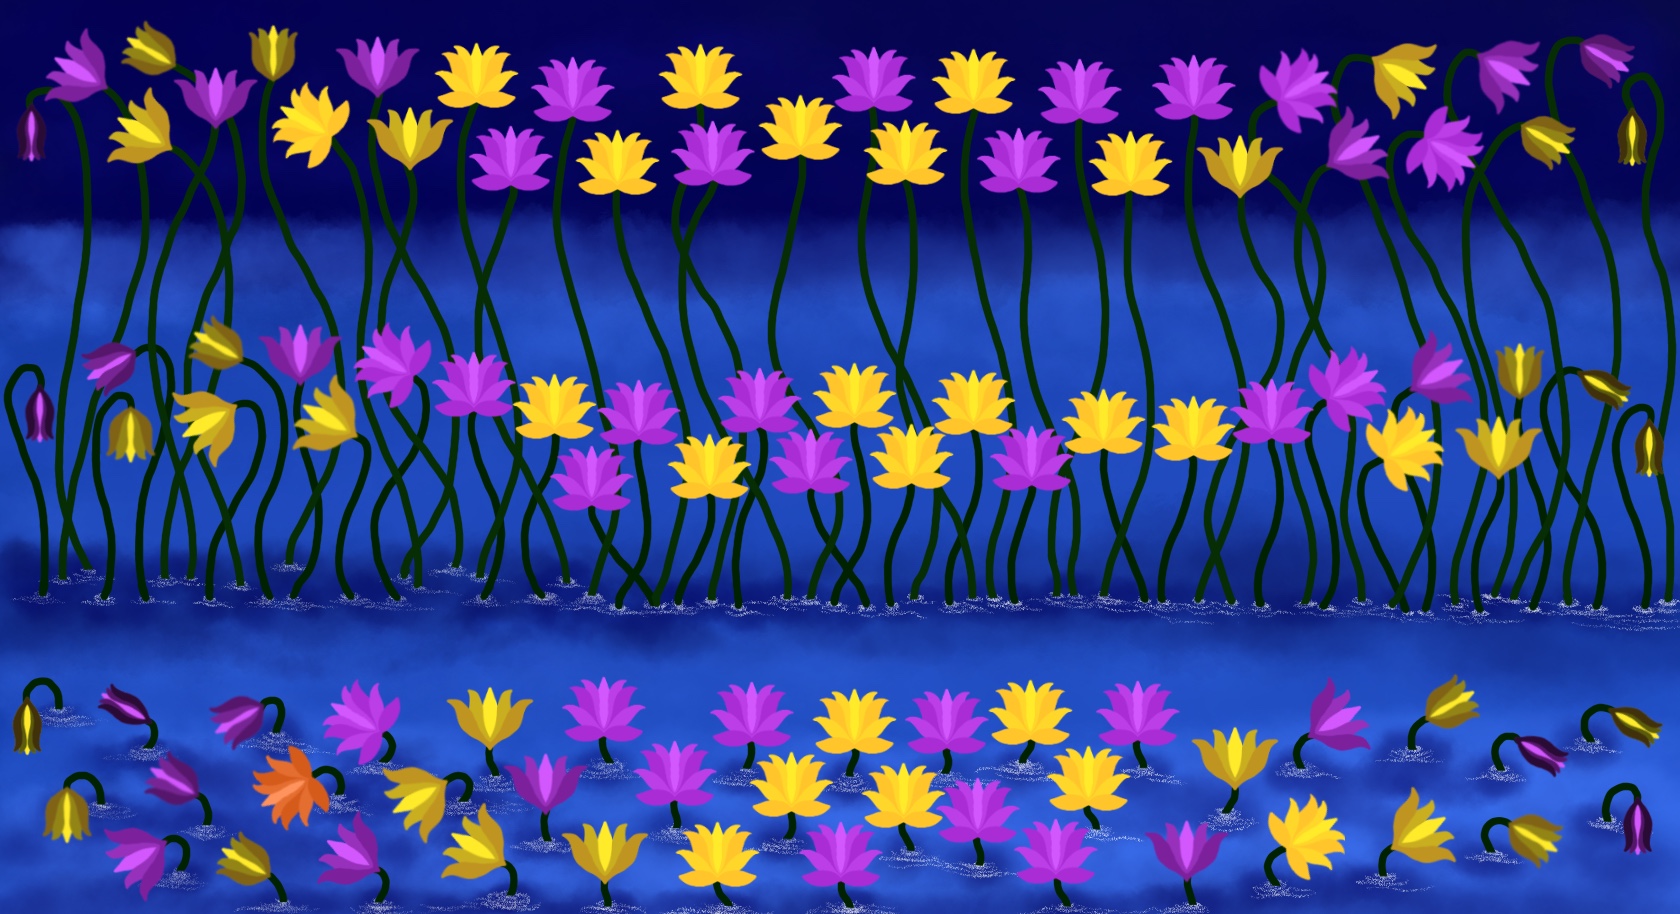
What you see below, is not just any image. It is a data representation of how lonely and depressed the people of Ontario felt during the first wave of the COVID-19 pandemic.
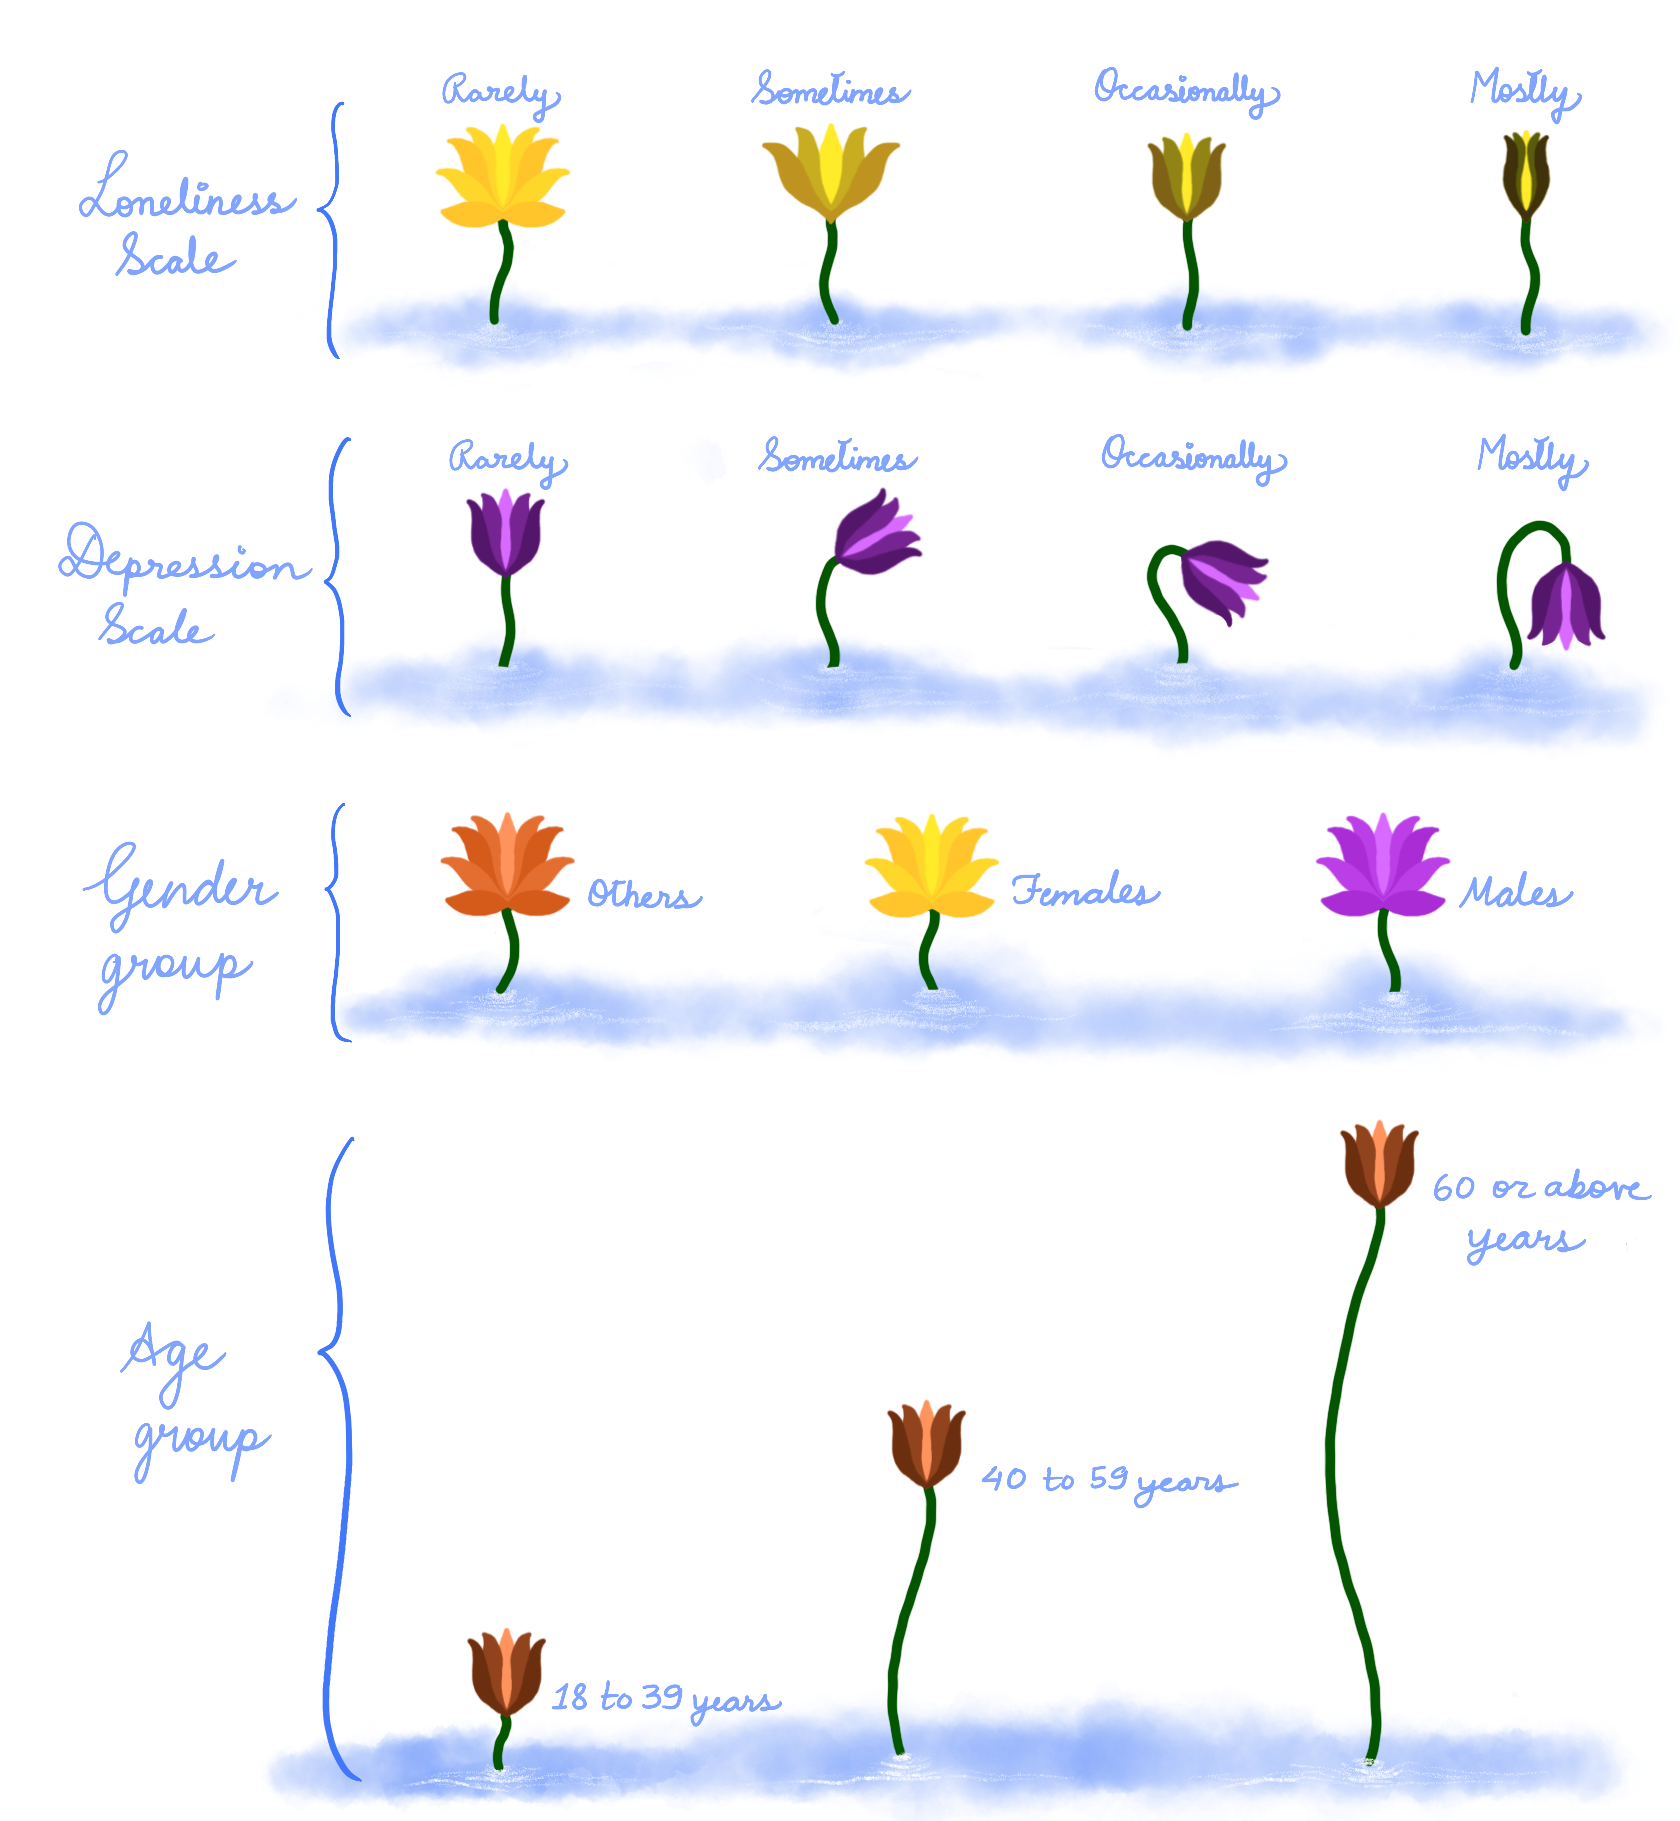
VISUAL ENCODING FOR THE DATA VISUALIZATION

* * Disclaimer * *
If certain elements or data trigger unpleasant thoughts or experiences, you may kindly take a break from viewing the data visualization. In this case, scroll directly to the end of this page for links to helpful resources and helplines that will guide you through the emotional distress.
The scale of loneliness felt (based on a weekly analysis) ranges from people who felt lonely ‘rarely (less than a day)’, ‘sometimes (one to two days)’ ‘occasionally (three to four days) and ‘mostly (five to seven days)’. The more lonely a person felt, the more closed-up and darker the flower looks. The colour of the flower corresponds to the gender group the person belongs to.
The scale of depression felt (based on a weekly analysis) ranges from people who felt depressed ‘rarely (less than a day)’, ‘sometimes (one to two days)’ ‘occasionally (three to four days) and ‘mostly (five to seven days)’. The more depressed a person felt, the more wilted the flower looks.
The length of the stem of the flowers corresponds to the age-group that they belong to, such as ’18 to 39 years’, ’40 to 59 years’ and ’60 or above years’ of age.
STATISTICS ABOUT LONELINESS
Loneliness has affected people all across Canada during the COVID-19 pandemic. Below are some statistics spanning the entire country.
During the month of May 2020, 29% of the people who belonged to the 18-39 age group were feeling lonely. Based on the gender groups, 25% of the female population felt lonely compared to 21% of the male population that felt lonely.
During the first wave of the COVID-19 pandemic (May to September 2020),
- - Depression rose in the 18 to 39 age group the most. By the end of the first wave in September, 27% of the Canadians belonging to the same age-group felt depressed.
- - Loneliness rose by 5% in the people belonging to the 40 to 59 age group.
- - Between 41.4% to 47% of the Canadians from all age groups who felt lonely were extremely worried about their finances.
** sources to the above data can be found in the CAMH.CA COVID-19 National survey dashboard.
WHAT CAN WE DO NOW
The world needs to be a kinder place. We can all use some love, gratitude and affection.
Those who are represented in the data visualization above, also need love, gratitude and affection… maybe in abundance.
We can help out friends, family, and others, whom we know are suffering loneliness by simply being that helping hand or the listening ear that they need.
BEING THERE FOR SOMEONE CAN DO WONDERS FOR THEM.
Reach out to your folks, stay connected and be there for those who may need you.
A small gesture can go a long way, just like the words that can help give them a sense of being close to you even if you are far away.
The data visualizations for the months of May, July and September 2020 shown above are static. They are a representation of the people who felt lonely and depressed.
What if we can interact with the flowers using other senses? How can we connect with these flowers who are representations of the people feeling lonely and depressed? How can we use our voice, words or touch to help them? Below are demonstrations of two variations of what can also be potential outputs that make use of these senses to help others:
- Use Voice or your words to help others
- Learn about the people affected by Loneliness and Depression
VIDEO AND INTERACTIVE DEMOS
- Here is a small animated video demonstrating how your voice can be used in an empathic way. It shows how spoken words can create a change in the loneliness felt by people being represented by the flowers.
- An interactive demonstration to mimic the human behaviour of touching in the real world, this demo allows you to click on the flowers to learn more about who these people are. Once you touch a flower, you will hear a voice that shares what we know about these people from the data. There are no stories being narrated, as the data didn't have any stories. A single person's voice has been used across all flowers to maintain consistency and to avoid adding any unknown identity layers through the usage of multiple voices.
As seen in the different outputs above, these are some ways that can help the viewer understand and create an impact. If you know someone who is feeling lonely or depressed. This is what I am offering at the moment. In no way are these the only ways to represent the data. There are many alternate ways that hold the ability to create a similar impact.
If you know people who are suffering, please reach out to them. Talk to them and stay connected with them.
For more information about loneliness and related issues, kindly follow the resource links shared below.
If you are SOMEONE WHO IS FEELING LONELY or KNOW SOMEONE WHO FEELS THAT WAY, please reach out to the helpline numbers shared below.


